Infographics

Infographics

Infographics

Infographics

Infographics

Infographics Infographics Infographics Infographics Infographics

A picture is worth a thousand words, especially if the topic is new to the viewer.

These infographics do not include data and statistics; rather they depict what is possible with technology and enable viewers to imagine how to use IoT solutions.

Infographic highlights the complementarity of LoRaWAN and Bluetooth technologies for affordable scaling of Bluetooth IoT solutions by extending battery life, expanding number of devices, and range. Features a typical Bluetooth Low-Energy (BLE) solution, detailing components like BLE sensors and gateways, and metrics on CAPEX, battery life, and range.

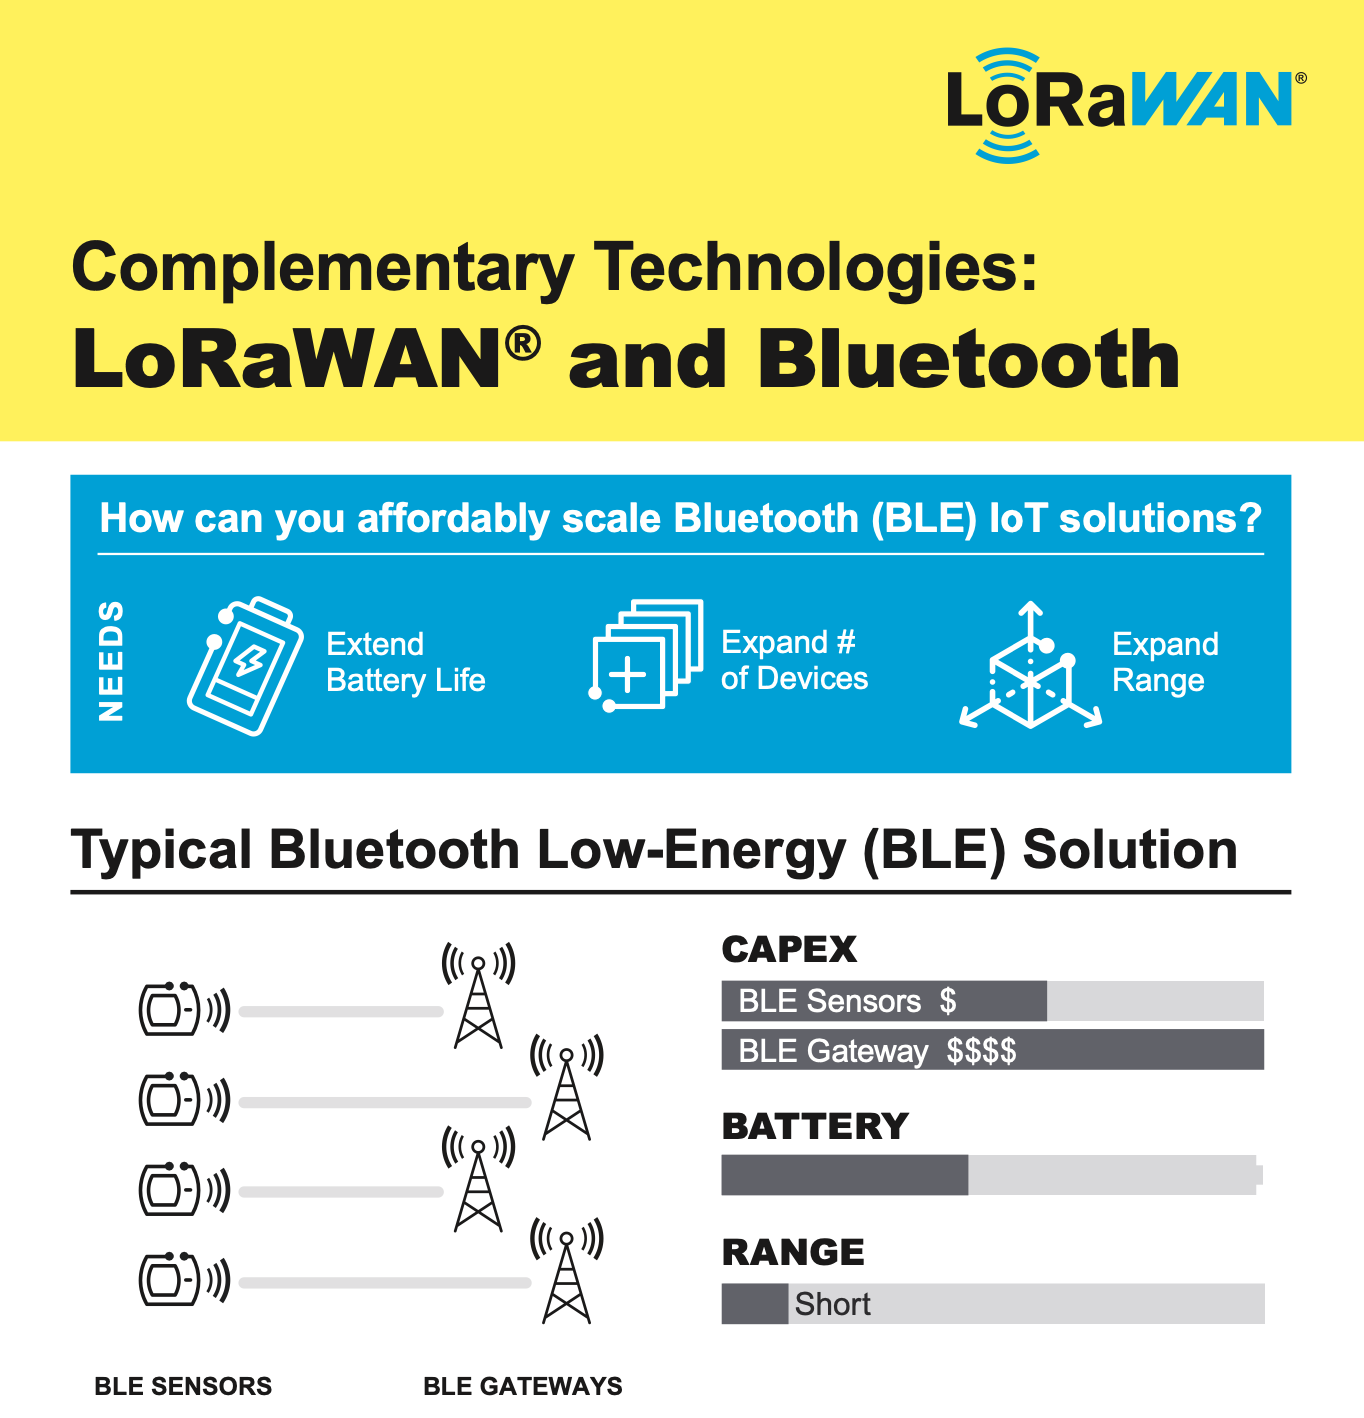
Complementary Technologies: LoRaWAN® and Bluetooth

LoRaWAN® for Smart Agriculture

Infographic comparing LoRa and LoRaWAN by LoRa Alliance. It describes the differences: LoRa is a wireless IoT platform using Chirp Spread Spectrum for radio, encoding data on radio waves. LoRaWAN is an open standard managing data flow via a MAC layer. Benefits of LoRa include low power and long-range data transfer. Benefits of LoRaWAN include security, adaptive data rate, and global standard features. The infographic includes a LoRaWAN architecture diagram showing components: device, gateway, network server, application server. A QR code links to more information.

LoRa® and LoRaWAN®: what’s the difference?

Illustration of wireless smart building solutions using LoRaWAN technology, showing banks, cafes, legacy, modern, and new constructions with various IoT devices for air quality, occupancy, metering, leak detection, and energy optimization.

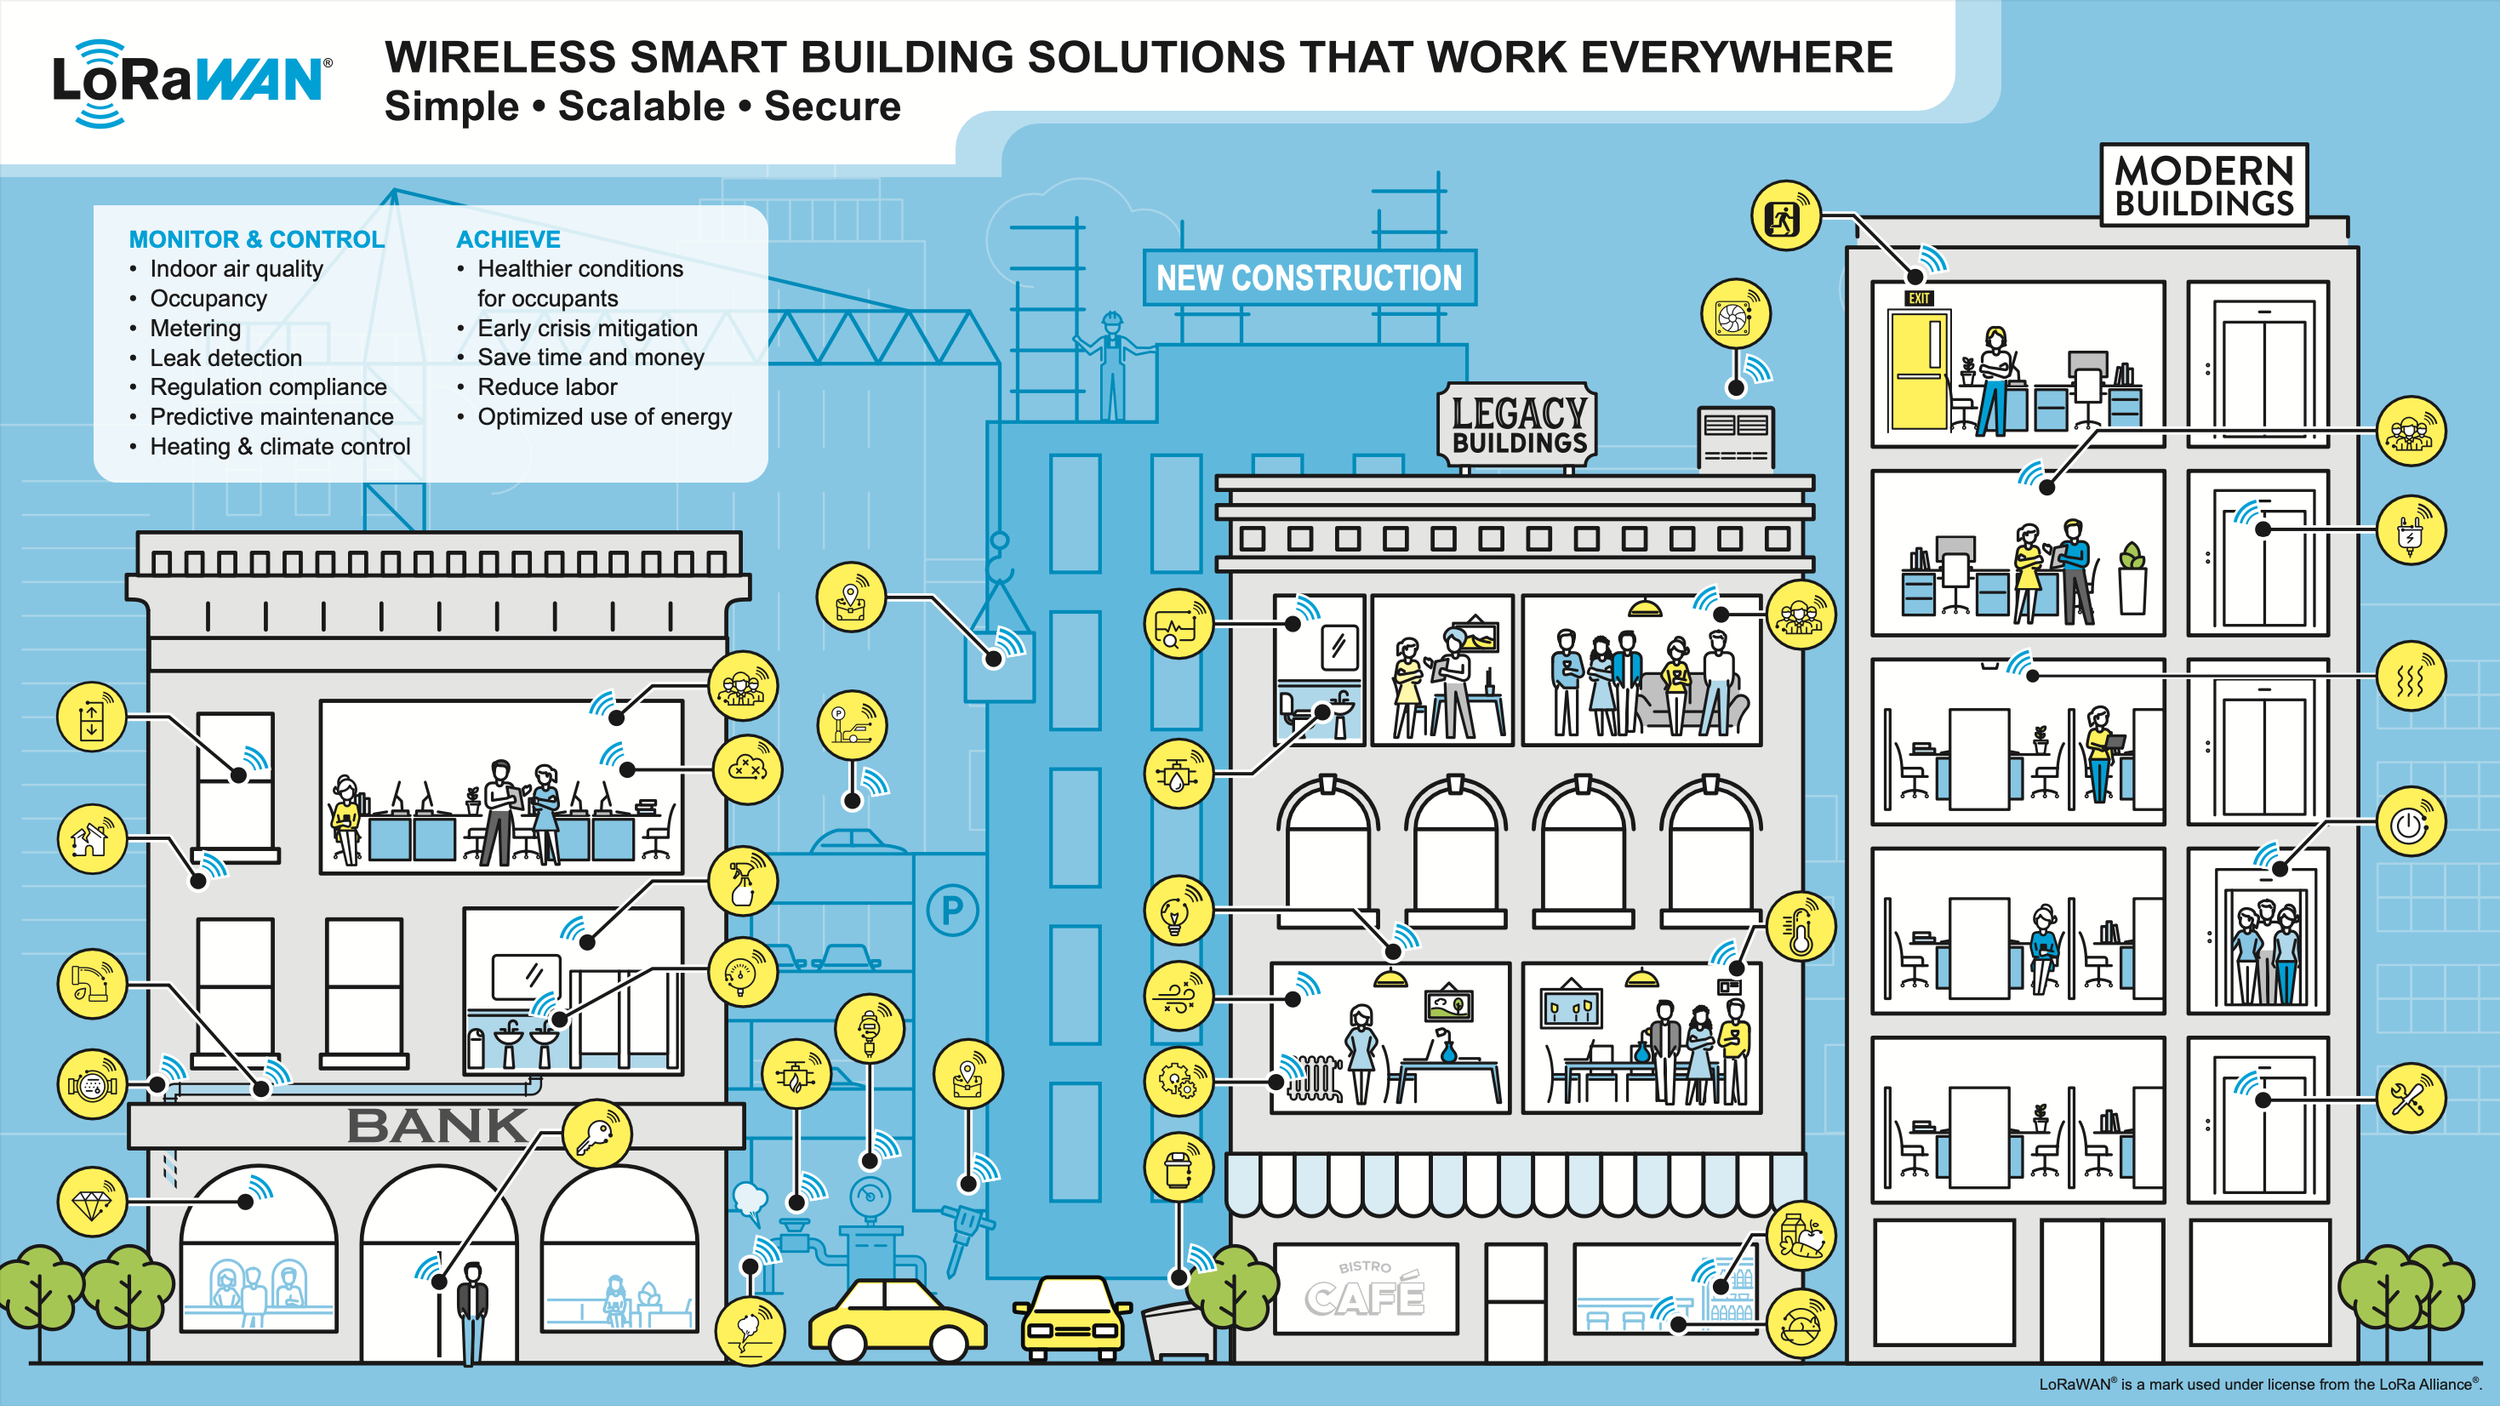
LoRaWAN® for Smart Buildings

Infographic depicting building intelligence with LoRaWAN technology, illustrating various smart building features like ventilation, emergency lighting, air quality monitoring, smart lighting, occupancy tracking, CO2 monitoring, heat actuation, predictive maintenance, waste management, water monitoring, gas leak detection, structural integrity, and smart parking. The features are shown in relation to different sections of a multi-story building.

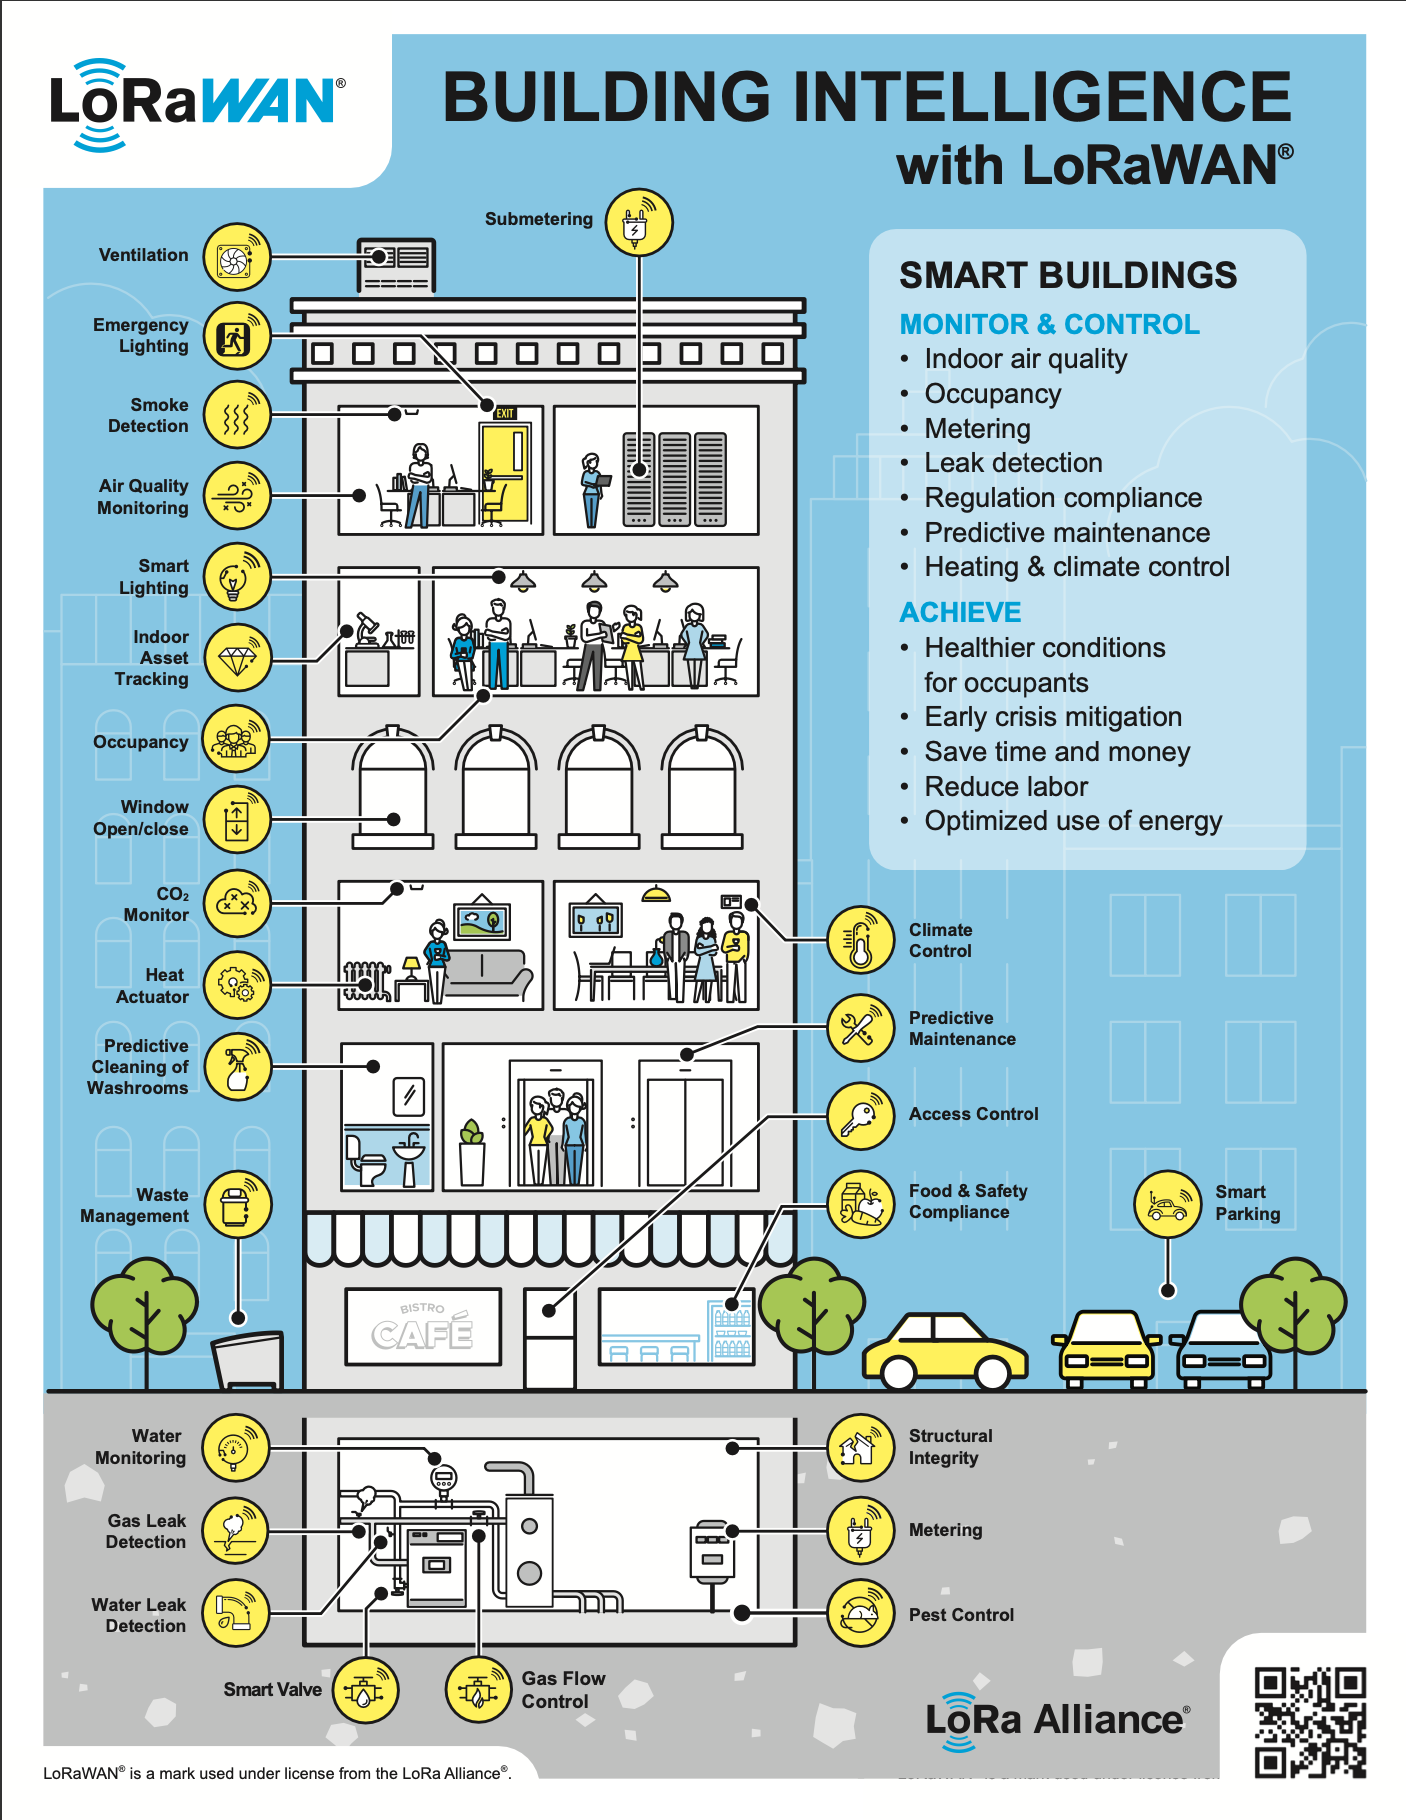
Building Intelligence with LoRaWAN®

Illustration showing various applications of LoRaWAN in a smart city, including noise levels, air quality, traffic lights, parking space occupancy, utilities monitoring, weather sensor, leak detection, and energy monitoring, with connectivity depicted by blue signals and labeled components across urban landscape.

LoRaWAN® Connects Cities

Illustration showing the use of LoRaWAN in smart utilities, depicting a city with various sensors like electricity meters, water leak detectors, and gas monitors. Shows transmission lines, renewable energy sources, and buildings. Labels highlight the benefits of monitoring and controlling utilities using LoRaWAN, such as sustainable resource management and precise billing.

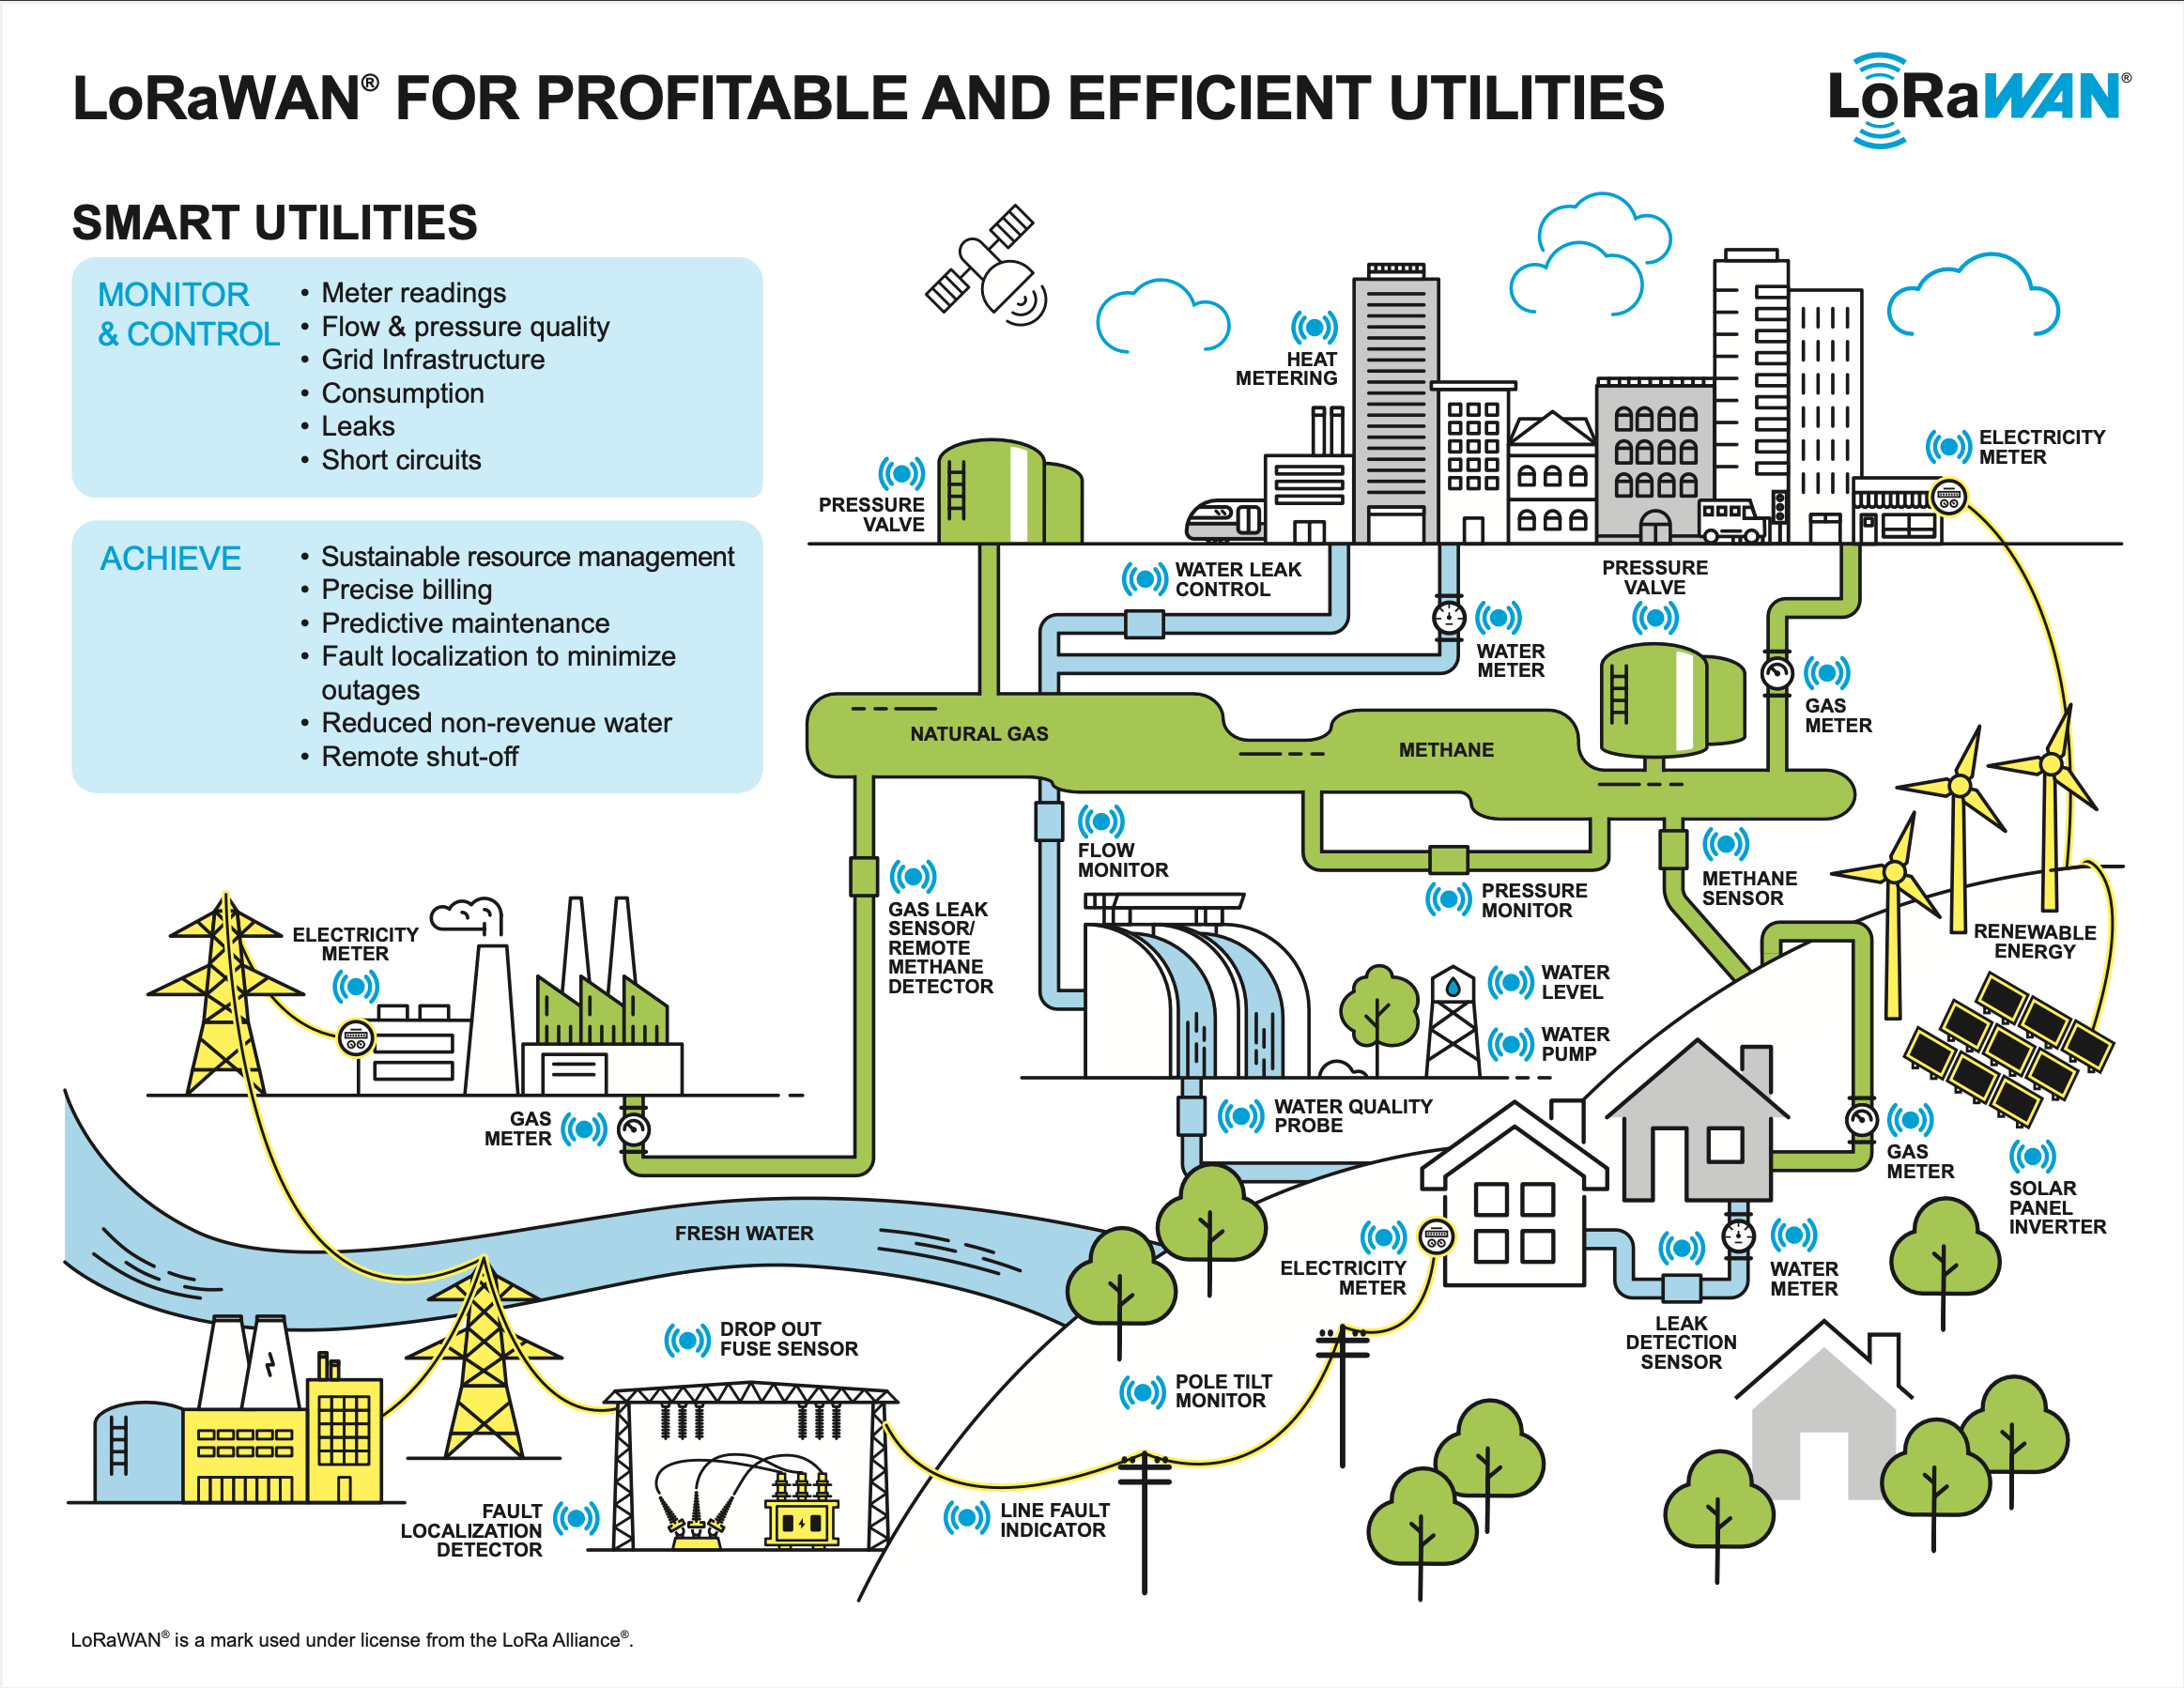
LoRaWAN® for Profitable and Efficient Utilities

Infographic explaining Internet of Things (IoT) applications. This includes Business to Consumer IoT with video doorbells, Business to Business IoT with leak detection, and Remote Business to Business IoT with maritime logistics tracking. Illustrates sensors, cameras, routers, gateways, satellites, and applications used in these processes. Includes a comparison of before and with IoT benefits.

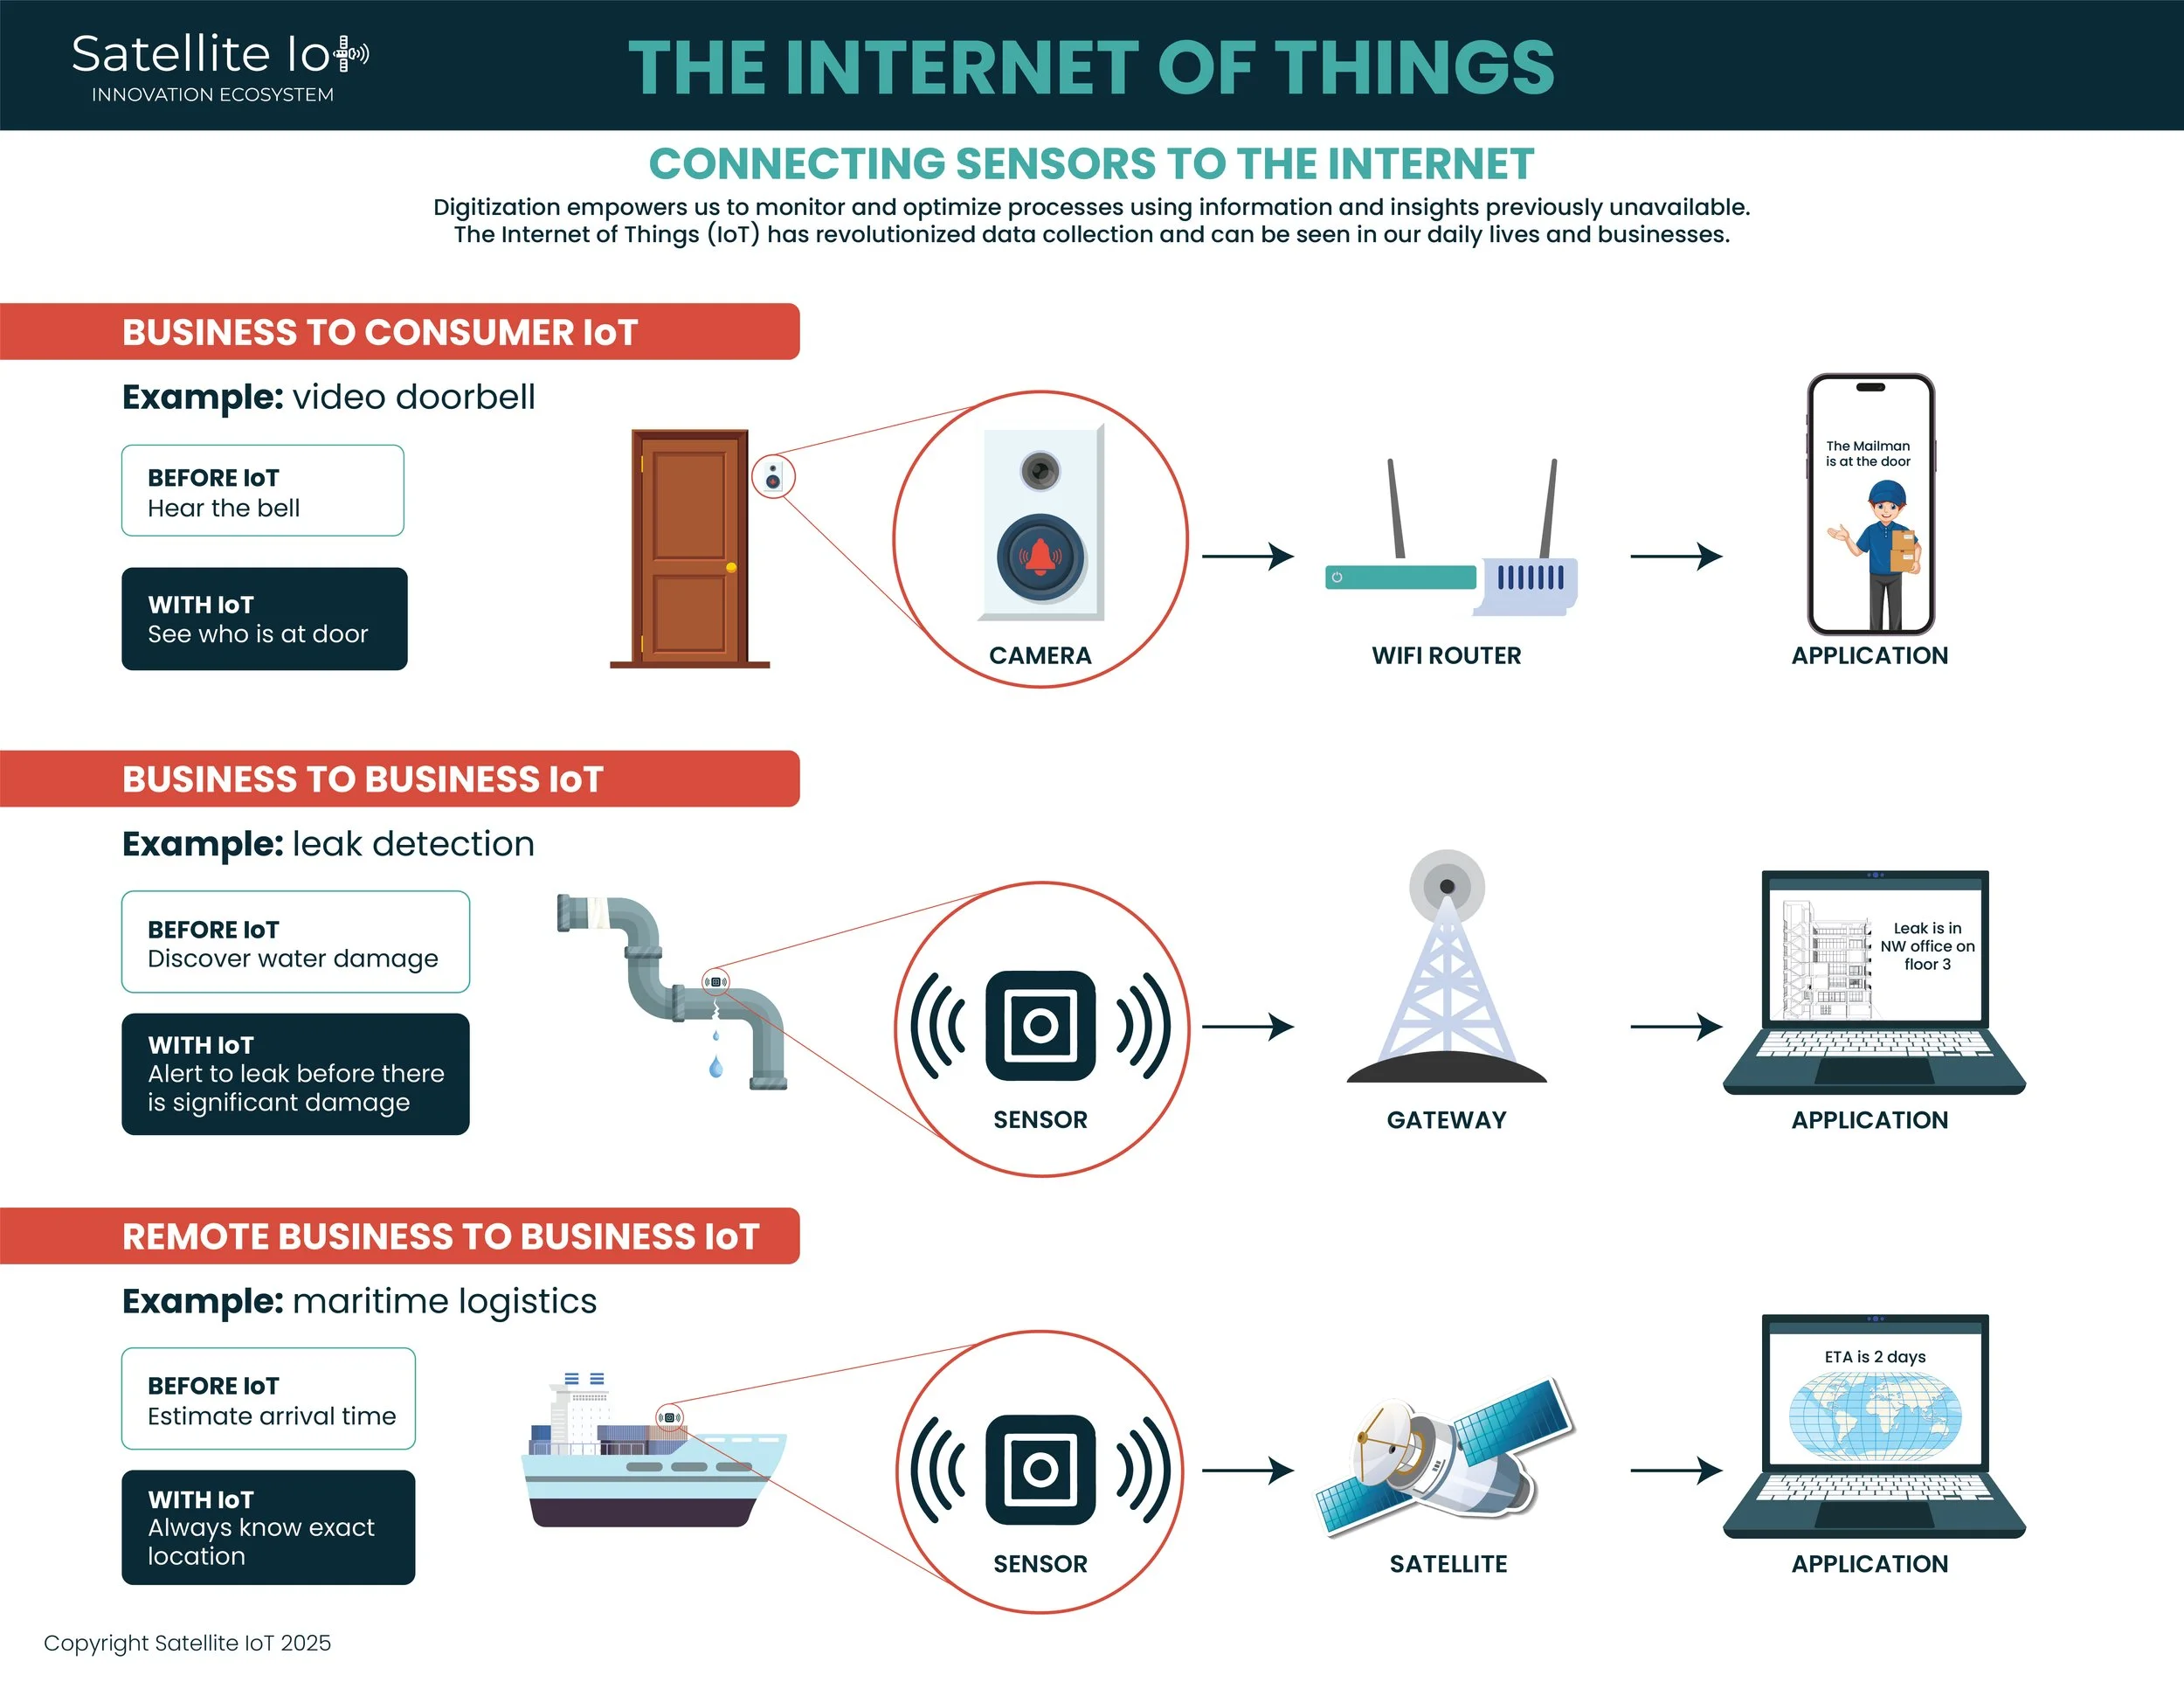
What is the Internet of Things?